Sunday, February 27, 2011

An Analysis of Talvivaara Mining Company

Executive summary

Talvivaara Mining Company Plc. (LSE: TALV; Nasdaq OMX Helsinki: TLV) has an open-pit Nickel mine in Sotkamo, Finland. The project leverages one of the largest known sulphide nickel resources in Europe. Production at the mine started in October 2008 and production ramp up is still ongoing. The planned annual nickel production is 50,000 tonnes. As by-products the mine will also produce approximately 90,000 tpa of zinc, 15,000 tpa of copper and 1,800 tpa of cobalt. Also uranium can be extracted profitably from the ore if Finnish state gives OK for this. Talvivaara uses a process called "bioheapleaching" to extract the metals from ore.

Talvivaara has 1121 million tonnes of mineral resources in ”measured” and ”indicated” categories and additional 429 tonnes in category ”inferred” (no reserves). Mine life is expected to be close to 50 years. This analysis concludes that Talvivaara, once in full production, should have revenues at close to 1,2 billion euros (at current metal prices). Possible uranium extraction, end of Zinc streaming agreement and near mine exploration will be increasing the revenues and the result in the long term.

Given the current stock price of 6,6 euros (Helsinki stock exchange), to me it seems that market values Talvivaara at P/E 9,5-11,8 against intermediate 30ktpa Nickel production (target 2011, but there are concerns to that end). However, given full capacity of 50ktpa Talvivaara is undervalued at current metal prices at P/E below 4.

I personally like Talvivaara because it is a local (Finnish) project, has long expected mine life and to me looks like attractively valued when taken into account the full production targets.


Introduction

Talvivaara Mining Company Plc. (LSE: TALV; Nasdaq OMX Helsinki: TLV) has an open-pit Nickel mine in Sotkamo, Finland. The Talvivaara polymetallic deposits, Kuusilampi and Kolmisoppi, comprise one of the largest known sulphide nickel resources in Europe.

Production at the mine started in October 2008 and production ramp up is still ongoing. The target for year 2011 is to produce 30,000-35,000 tonnes of nickel. However, since they could not sustain 30,000 tpa production rate in 2010 than only for a while, the target seems to be tough to say the least.

The planned annual nickel production of 50,000 tonnes is anticipated to be reached in 2012, but let’s see first what happens in 2011. At any rate, I will be analysing the company with the full production rates in mind. It may happen 2012 or then get delayed. To me it does not matter as it does not fundamentally change the outcome of the analysis.


Picture 1. A Chunk of Nickel. Source: Wikimedia Commons.

As by-products the mine will also produce (at full production) approximately 90,000 tpa of zinc, 15,000 tpa of copper and 1,800 tpa of cobalt. Also uranium can be extracted profitably from the ore if Finnish state gives OK for this. Talvivaara use a process called "bioheapleaching" to extract the metals from ore.

Talvivaara has launched ”Operation Overlord” to study and implement expansion beyond 50,000 tpa Nickel production. Scoping study is scheduled for 2011 and production ramp up target is 2015. Talvivaara states that they have also excellent near-mine exploration potential especially between Kolmisoppi and Kuusilampi deposits.

Mineral Resources

Talvivaara has 1121 million tonnes of mineral resources in ”measured” and ”indicated” categories and additional 429 tonnes in category ”inferred”. Resources in the lowest category (”inferred”) have more uncertainities regarding tonnage and grade compared to highest category (”measured”).


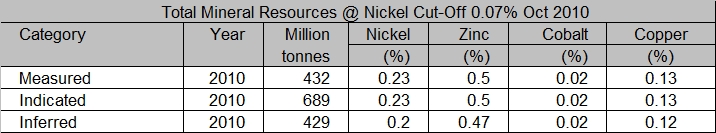
Table 1. Mineral Resources.

Talvivaara does not have Mineral reserves (either ”proven” or ”probable”) yet. The reason for this is unknown to me, but according to the Australasian Code for Mineral Resources and Ore Reserves or ”JORC code” that Talvivaara have used as basis of its resource statement it requires not only geological facts, but also ”Consideration of mining, metallurgical, economic, marketing, legal, environmental, social and governmental factors” to upgrade ”measured” resources to ”proven” and ”indicated” resources to ”probable”.

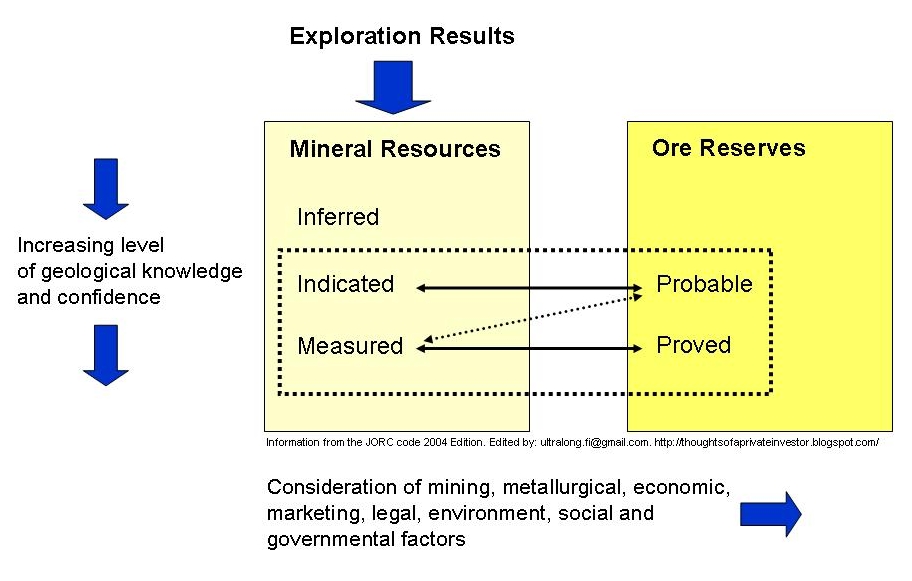
Picture 2. The relationship between mineral resources and Ore Reserves as described in the JORC code (2004 Edition).


Chris Morrissey, a former chief geologist of the Rio Tinto Group, explains the ins and outs of resource/reserve statements in the arcticle titled ”In the opinion of a Competent Person” published Rio Tinto Review magazine, issue 80: ”With some deposits there is so much natural variability, for instance in grade and shape, that the high levels of confidence needed for proved reserves are impossible to achieve. Nuggety gold veins are an example of that, as are diamond deposits in which much of the value comes from stones of exceptional size and quality which are so rare that no amount of sampling can safely indicate how often they will be mined."

"Reserves are the highest form of mineral asset a mining company can have. They are not as good as money in the bank, but they can be given a monetary value in the company’s balance sheet. They are normally replenished from resources attributed to the same operation, by building up positive information on the largely non geological matters listed. Technical and economic matters are only part of it; reputational considerations are very important too, as well as questions of title and ownership. It is a two way street, meaning that reserves can be “demoted” if crucial information proves faulty or turns negative.”
Calculating from the resource statement one can get the amount of each metal Talvivaara assumes to be in the ground. The calculation assumes 100% accuracy in the statements 100% recovery of each metal.

Table 2. Amounts of metals in the ground.

I have seen statements of mine life varying from 46 years to 60 years. If calculating from the above table, one gets 52 years and 69 years for mine life assuming 100% accuracy/100% recovery for M+I and total resources respectively. Clearly, Talvivaara does not assume 100% recovery so their statements regarding mine life are less than the ”ideal” calculation suggests. In any case, 50 years or so is eternity in the modern investment world.


Metal Prices
In my analysis, I use the following metal prices (USD / metric tonne):

Metal: 5 Year Lows: Current Price level

Nickel $10000 $28000
Copper $3000 $9750
Cobalt $30000 $42000

Base case” will later indicate ”Average of Current price and 5 year lows” for these metals.
EUR/USD = 1,35
Zinc* $472.5/t
Uranium (Yellow Cake) 50 USD/lb (82 EUR/kg)

*) The Zinc price reflects the 1.25 Mt streaming agreement that will be in place for the next 14-17 years depending on production ramp up (i.e. when 90 ktpa capacity is reached). According to the agreement there will be 350 EUR/t fee and 335 million USD pre-payment against the first 1.25 million tonnes of Zinc from Talvivaara.

Below you can see 5 year price level in the London Metal Exchange for each metal courtecy of metalprices.com.

LME Nickel Prices 5 Years


LME Zinc Prices 5 Years


LME Copper Prices 5 Years


LME Cobalt Prices 5 Years


Value of Talvivaara production

Assumptions: Copper 75% net smelter return. Cobalt 59% net smelter return.

Production level 30 ktpa Nickel (2011)

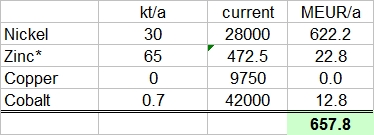
Table 3. Value of production (30ktpa Nickel)
*) Streaming contract.


Production level 50 ktpa Nickel (2012)

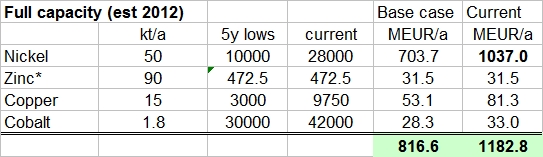
Table 4. Value of production (50ktpa Nickel)

*) Streaming contract.


Potential additional profit

Uranium

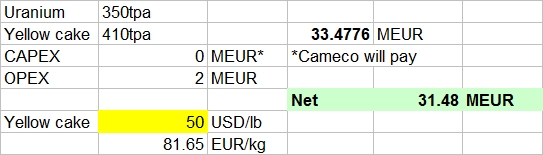
Table 4. Value of potential uranium production


Zinc

Table 5. Additional profit from Zinc production once the streaming contract ends.


Valuation of Talvivaara Mining Company

The following calculation assumes:
  • Operational costs 2011: 245 MEUR, 2012: 270 MEUR
  • Depreciation etc. 2011: 60 MEUR, 2012: 64 MEUR
  • Capital expences 2011: 80 MEUR, 2012: 30 MEUR
  • Finance costs: 30 MEUR/a
  • Corporate tax level 26%
  • Talvivaara stock quote in Helsinki 25.2.2011: 6,6 EUR
  • Stocks (fully diluted): 263,669,291
  • Attributable to owners: uses same ratio as used in 2010 annual P&L calculation

Table 7. Estimated profit level for 30ktpa (2011) and full capacity (2012).
Talvivaara stock appears to be cheap if compared to what it is capable of producing at full capacity at current price levels of Nickel and other metals. On the other hand, it does not appear to be that cheap compared to 2011 production target given that it may be hard for Talvivaara to reach the announced 30-35 ktpa capacity this year. If it does achieve this and it seems that 50 ktpa production target is feasible and probable, then the stock is likely to soar as P/E 2012 under 4 is very low indeed. Even in the case of lower metal prices (assuming ”base case”) the P/E is below 7.

Another way to value Talvivaara is to look at statements it is has made regarding net cash cost of Nickel. Talvivaara states that they expect net cash cost of Nickel to be 2.3 EUR/lb in 2011 and 1.6 EUR/lb in 2012. ”Net cash cost” means in this case ”net of by-product credits”. That is, all other metals are sold to lower the production cost of Nickel. Using these the Net cash cost of production for 2011 is 152 MEUR (30ktpa) and 176 MEUR (50ktpa) for 2012.


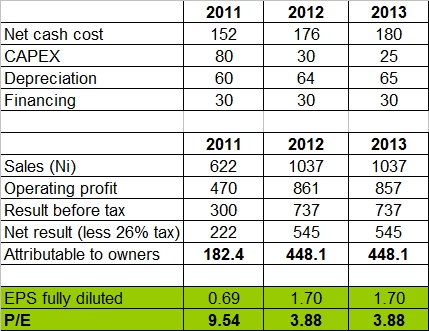
 Table 8. Estimated profit level for 30ktpa (2011) and full capacity (2012-2013).


In the long term the following factors drive revenue and the result upwards:

  • Increase inmetal prices (speculative)
  • Possible increase of production capacity beyond 50ktpa (Operation Overlord)
  • Zinc production valued at market price (takes 14-17 years)
  • Increase of mineral resources via near mine exploration
  • As emerging major player in Finnish mining scene, Talvivaara is well positioned to aquire projects from junior mining companies.
I personally like Talvivaara because it is a local (Finnish) project, has long expected mine life and to me looks like attractively valued when taken into account the full production targets.

Full disclosure: Long Talvivaara at the time of writing.

***

Source material used in the analysis:

Notes:

JORC refers to ”The Joint Ore Reserves Committee of The Australasian Institute of Mining and Metallurgy, Australian Institute of Geoscientists and Minerals Council of Australia”.

Tonne = metric ton = 1000 kilograms
kt = kilotonne = 1000 tonnes
Mt = Megatonne = Million tonnes
tpa = Tonnes per annual
ktpa = 1000 Tonnes per annual

Saturday, February 26, 2011

Added to BYD position

BYD (HK:1211, Pink Sheets: BYDDF, Frankfurt Xetra: BY6) have lost over 30% since I took a position in it.

Chart courtesy of StockCharts.com.

It appears that BYD did not meet their sales targets for 2010 are are slashing prices. Thus, the downward movement. Also, money seems to be moving away from emerging markets and specifically from China (as illustrated by iShares FTSE China 25 Index Fund (NYSE: FXI):

Chart courtesy of StockCharts.com.


Since I don't see any reason to exit this long term position and given that I already suffered the loss, I decided to buy some more of it. I was anyway going to add to this position at some point of time and now seemed to be a good point to do it.

Thursday, February 24, 2011

Bought shares of Talvivaara Mining Company

This week I added a new stock to our portfolio: Talvivaara Mining Company. Talvivaara is listed in Helsinki and London stock exchanges. I had to let go of some of my gold for this, but I think this mine has far more potential / inflation protection than gold in itself.

Some facts (source: Talvivaara web site):
  • Talvivaara Mining Company Plc. has an open-pit Nickel mine in Sotkamo, Finland.
  • Production at the mine started in October 2008.
  • Production ramp up is still ongoing.
  • The planned annual nickel production of 50,000 tonnes is anticipated to be reached in 2012 (intermediate target: 30,000 tpa 2011).
  • As by-products the mine will also produce aprox. 90,000 tpa of zinc, aprox.15,000 tpa of copper and c.1,800 tpa of cobalt.
  • Also uranium can be extracted profitably from the ore if Finnish state gives OK for this
  • The Talvivaara polymetallic deposits, Kuusilampi and Kolmisoppi, comprise one of the largest known sulphide nickel resources in Europe with 1121 million tonnes of ore in measured and indicated categories, sufficient to support an anticipated production for at 46 years.
  • Talvivaara use a process called "bioheapleaching" to extract the metals from ore.
  • Excellent near-mine exploration potential
I am working on an analysis of Talvivaara which I plan to publish later on.

Friday, February 18, 2011

Gold or Gold Miners?

I am bullish on gold and view it as a perfect portfolio hedge against all ills ranging from inflation to yet another financial panic. I also have shares of gold miners in my portfolio because they should appreciate even faster than gold itself. Profits of gold miners that do not hedge their output tend to swing much more than the price of gold because their expenses do not have relation to gold price but their profits do. If you are not bullish on gold or you are sensitive to large swings in share price you should not own shares of gold miners.


Example: Let's assume a hypothetical gold miner "A" can extract gold from ground with average "cash cost" of $700 per troy ounce of gold. In addition, let's assume that all other costs related to the ongoing mining operations (depreciation of assets, etc.) are $200/oz. With an average gold selling price of $1300/oz the company makes pre-tax profit of $400 per ounce. If the price of gold changes 10% in this hypothetical case (i.e. $130, up to $1430 or down to $1170) the profit changes 33% (i.e. $400 plus/minus $130).

..The rest of the article can be read only from Seeking Alpha:
http://seekingalpha.com/article/253292-gold-or-gold-miners

Sunday, February 13, 2011

Portfolio Allocation Status

I have now 21 companies in our portfolio. The distribution of funds is as follows:

Sector: Portion of funds: (Target)

Cash 2.5 % (0%)
Gold 13.1 % (10%)
Green Energy Technology & Generation 15.8 % (15%)
Health Care 15.7 % (15%)
Information Technology 10.8 % (15%)
Mining & Exploration 11.5 % (15%)
Oil & Gas Production 12.8 % (15%)
Telecommunications 17.7 % (15%)

Chinese companies China Mobile and BYD have been going down since the purchases. Also Cisco is down 10%. Despite of this, I continue to believe in these companies. In general, I am waiting for the dividends to roll in.

Saturday, February 12, 2011

First Year of Blogging

Exactly one year ago I published my first article titled "Gold Fever!" in this blog. It took me a while to decide whether I use english or finnish, but I selected english because I believed that what I say interests probably more outside Finland than inside. Looking back using Google Analytics as tool - I was right. So far there has been 5,867 page views from 2,881 unique visitors from 95 countries. Thanks for interest! This is certainly much more than I ever expected to have after first year!!

Top 5 traffic sources (countries)

1. Finland
2. United States
3. Canada
4. United Kingdom
5. Australia


Top 5 traffic sources (sites/referral)
1. Direct
2. Google
3. AP Areena / Arvopaperi.fi
4. Seeking Alpha
5. My finnish blog


Top 10 articles (pageviews)

1. Nautilus Minerals
2. Fred Olsen Energy
3. An Indepth Look on Sanofi-Aventis*
4. The Myth Of Moore's Law
5. Soros and Gold
6. Is Western Digital a Bargain*
7. The End of The Golden Age*
8. Financial Crisis 2.0
9. Critical Materials for Clean Energy Technology
10. BYD - Build Your Dreams*

The articles marked with asterix (*) have been also published as articles in Seeking Alpha. Seeking Alpha focuses on U.S. stock market so the qualifying articles have to touch subjects that interests their readers. I typically submit such articles atleast to my "instablog" at Seeking Alpha.

The pageviews for my articles at Seeking Alpha have ranged from 3,640 to 54,389 per article (typically some thousands rather than >10,000). Encouraging numbers - so I will keep on writing.

Friday, February 11, 2011

Nokia and Microsoft

I added both to our portfolio. I have been Nokia holder many times during last 15 years and have considered lately to buy in again. Well, today came the perfect opportuníty. I am glad I didn't buy before the big announcement, because now I got them below 7 euros. And that I consider to be some seriously cheap Nokia stock. For one thing, I do not think market really values Nokia Siemens Networks (a joint 50/50 venture owned by Siemens and Nokia) and Navteq at all. Not that they contribute much to the overall result. Nevertheless, as separate companies each would be worth billions. Therefore, I believe there exists a healthy margin of safety in the current valuation of Nokia (forward P/E 11.96, P/FCF 11.77, P/B 2.08). In addition, the dividend yield is now in the range of 5%.

Microsoft, on the other hand, stands to gain handsomely from the Nokia's announcement to focus on Windows Mobile. Markets obviously don't think so as Microsoft was trading downwards both today and yesterday when Nokia-Microsoft deal was already looking quite obvious given all news, leaks and speculation on the subject.

Microsoft, like I have written before, is one of those companies that have moat. Economic moat is a competitive advantage that is difficult to copy or emulate and which provides a significant barrier to competition from other firms. Warren Buffett has often referred to an economic moat as being similar to a fortress or a medieval castle that one can not penetrate. Microsoft is as close to monopoly (in PC/laptop operating system market) as a company can get.

Like Nokia, Microsoft is also attractively valued. Forward P/E 10, P/FCF 12.55 and P/B 4.77. Microsoft dividend is 2.3%. Both Nokia and Microsoft have a big pile of CASH making the valuations even more attractive.

Source for all stock data / valuations: Finwiz.com.

Thursday, February 3, 2011

Critical Materials For Clean Energy Economy

Rare Earth Elements

Rare earth elements have geochemical properties that make them typically dispersed and not often found in concentrated and economically exploitable forms [Wikipedia]. These metals are used in many hi-tech devices. In particular, rare earth elements are used in clean energy applications such as wind turbines, electric vehicles, photovoltaic cells and energy-efficient fluorescent lighting. Clean energy technologies currently constitute only about 20 percent of global consumption of critical materials. However, their share of total consumption is expected to grow as the use of these clean energy technologies is expected to grow rapidly.

Source: Critical Materials Strategy, U.S DOE, 2010.

Export restrictions placed by China for rare earth metals have raised conserns of supply disruptions. However, the Critical Materials Strategy published by U.S Department of Energy in December 2010 points out that only a handful of rare earth elements are actually at risk of supply disruptions in medium term (5-15 years).

Table 1. Critical materials for clean energy technologies (Data source: Critical Materials Strategy published by U.S Department of Energy in December 2010)

The table 1 summarizes the key data in the DOE report in my opinion. The materials that are either listed as critical (red) or near critical (yellow) are bolded. The ”criticality”-factor in the table is a sum of “supply risk” (1 = low; 4 = high) and “importance to clean energy” (1 = low; 4 = high) as determined by DOE in their report (see pictures below from the report for reference). Higher number indicates higher risks.


Short term Criticality Matric. Source: Critical Materials Strategy, U.S DOE, 2010.


Medium term Criticality Matric. Source: Critical Materials Strategy, U.S DOE, 2010.


If you want to know more about these critical materials I suggest that you check this rare earth primer, this excellent article about lithium and information about the periodic table.

Only five metals continue to be critical in terms of supply risk in medium term (5-15 years).

• Dysprosium (Heavy REE) is used in permanent magnets for wind turbines and vehicles with electric drive trains.

• Neodymium (Light REE) is used in batteries for vehicles with electric drive trains and in permanent magnets for wind turbines and vehicles with electric drive trains.

• Terbium (Heavy REE), Yttrium (Heavy REE) and Europium (Medium REE) are used in fluorescent lighting phosphors.

Most rare earth mines in operation provide lots of Lanthanum and Cerium as will do those mines that are the most likely to come online in the next 5 years. Therefore, Lanthanum and Cerium supply situation looks rather good compared to many other strategic materials.


Table 2. Projects that have possibility to come online in the next 5 years (Data source: Critical Materials Strategy published by U.S Department of Energy in December 2010)


The most attractive rare earth elements are naturally the ones with the highest risk of supply disruptions in medium term (5-15 years): Neodymium, Europium, Terbium, Dysprosium and Yttrium. These metals are highlighted as red in the table above. In terms of critical REO content out of total REO, the projects can be ranked as follows:

1. Alkane Resources: Dubbo Zirconia project (32,3%)

2. Avalon Rare Metals (AVARF.PK): Nechalacho project (29%)

3. Great Western Minerals (GWMGF.PK): Hoidas Lake project (24,3%)

4. Arafura Resources (ARAFF.PK): Nolans Bore project (22,3%)

5. Lynas Corporation (LYSCF.PK): Mount Weld project (15,7%)

6. Molycorp (MCP): Mountain Pass project (12,2%)

7. Vinacomin/Sojitz/Toyota-Tsusho: Dong Pao project (10,7%)

I happened to notice that Lynas Corporation has reported a bit different distribution of REO materials in their investor presentation from March 2010. Based on that report, the percentage of critical REO out of total REO is 19,1%. Nevertheless, I decided to go with DOE figures to be consistent as it was not possible for me to get data from all these corporations regarding exact REO content. Before investing in any of these companies, I suggest a thorough review of their resources and other projects as well as funding.


Lithium and two other metals determined as “near critical” to clean tech by DOE

Three metals are determined to be “near critical” in medium term (5-15 years).

• Lithium is used in batteries for vehicles with electric drive trains.

• Indium and Tellurium are used in photovoltaic thin films for solar cells.

Regarding Lithium the U.S. DOE reports: “Lithium is the only key material that shifts into a higher criticality category from the short to medium term. This change is due to the rapid increases in market penetration projected for vehicles using lithium-ion batteries, which increases lithium’s importance to clean energy. This market penetration would significantly increase demand even as lithium production capacity increases, thus increasing supply risk slightly.”

Lithium is best played in my opinion with Global X Lithium ETF (LIT) that includes lithium miners and battery manufacturers. The valuations of most companies included in the ETF are quite reasonable when compared to rare earth companies that are not even producing anything yet.

Full disclosure: Long LIT.